Government Software Engineering Community Blog

Blog posts from the UK government software development community

Atom Feed

At the NHS, we view APIs as services

Technology in government Friday March 06, 2020 @ 11:16 • 4 days ago

A screenshot of the UK government API catalogue

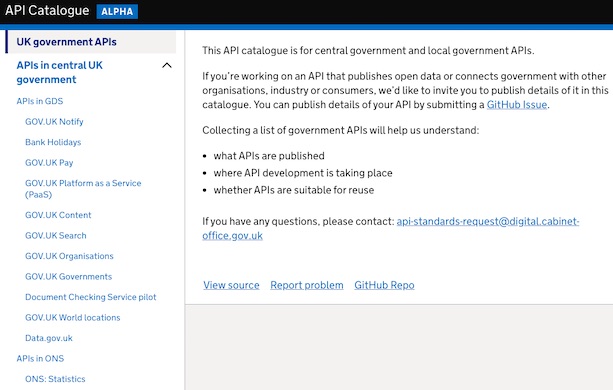
The Government Digital Service (GDS) Service Manual includes plenty of guidance on agile software delivery, including details of the specific phases of an agile project. Initially it’s not obvious how these phases should apply to delivering APIs. With a bit of interpretation the phases do fit quite well, but this relies on having strong experience in developing APIs. 

NHS Digital is working with GDS, HMRC and DWP to produce some guidance for API delivery teams to sit on GOV.UK. This is intended to help teams delivering APIs make sure they meet user needs. 

Publishing API delivery guidance on GOV.UK

In the latest refresh of the Service Standard, there’s a lot of focus on thinking more holistically about government services. That’s a really positive step. Delivery teams are now being challenged to make sure their online service works seamlessly with other channels such as phone, paper and face to face. An API is another of those channels, but it’s also a service in itself.

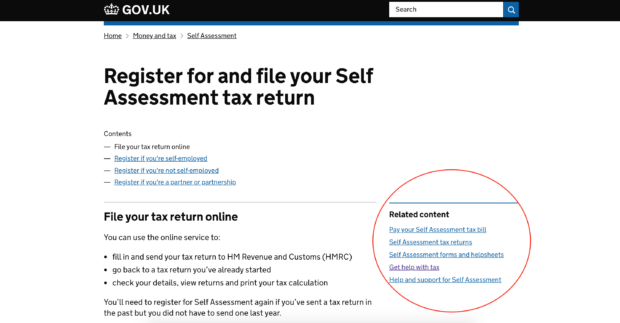
More and more teams are building APIs, often allowing citizens to interact with government services using third-party software. For example, citizens and accountants can submit tax returns via HMRC APIs directly from their accountancy software. 

APIs also allow government services to be incorporated into apps which do other things. In some cases, an API might be the main or only channel into a government service. This is true of HMRC’s Making Tax Digital for VAT service, and also for many of NHS Digital’s national healthcare services.

Often APIs are actually the services themselves. For example, GOV.UK Notify and GOV.UK Pay are both well known APIs that serve government users to help them transform citizen-facing services. Both APIs have gone through Service Assessments, and the reports are openly available. For instance, the Notify Beta Assessment is here on GOV.UK

Adding guidance on API agile delivery to GOV.UK will recognise that APIs are services too. It’ll also recognise that agile API delivery teams need different skills than teams working on citizen-facing services, and may need to focus on different areas.

For example, agile API delivery teams may need:

  • technically-minded user researchers to engage with software developers and end users
  • technical writers to produce API documentation and understand how to write for a technical audience, instead of a content designer working on online services content for end-users
  • API designers, such as an experienced developer or an architect with an understanding of the OpenAPI spec

These teams may also need a product owner, who might also own the online channel. 

Meeting the needs of APIs users

Since its creation, a key aim of GDS has been to encourage delivery teams to engage more with users - to understand their needs, test new services with users and to iterate those services until they work really well. Teams delivering online services now have user researchers, service designers, interaction designers, content designers, and technical writers as standard.

This user needs-first approach doesn’t seem to have been bedded in so well with teams delivering APIs yet. It’s common to come across API teams that haven’t done any user research, and it’s easy to see why. APIs are not intended to be used directly by people - they are used by other systems. However, APIs still have users. 

Users of APIs generally fall into 3 categories:

  1. Government users, for example software developers or technical architects, who understand the government context and who are using government APIs within their services.
  2. Third-party users, usually software developers, who need to design, build, test, and run the software that uses a government API, and who may be working with government APIs for the first time.
  3. End users of the third-party software, who need to use the complete service via that third-party software.

It’s important for teams delivering APIs to engage with these user groups, rather than assume they know what the API should do, build it, deliver it, and then move on to something else. Research to understand API users' needs can improve the design substantially, while reducing the time and cost of integration. 

For example, NHS Digital recently conducted a survey of healthcare software developers. The average rating for ease of integration with NHS Digital APIs was 2 out of 5.

Common pain points included:

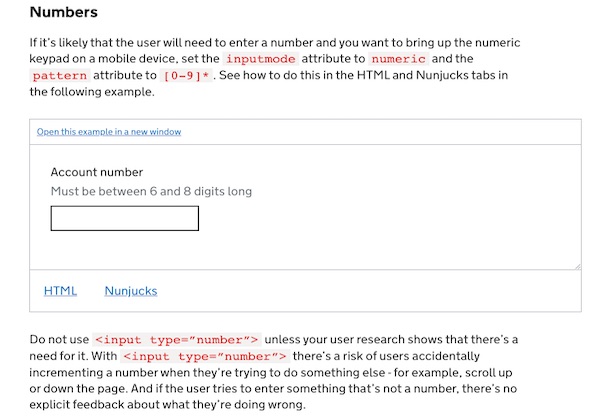
  • hard to find, poorly written, incomplete, or inconsistent API documentation 
  • APIs which were technically complex and hard to integrate with
  • hard to access or not useful test environments 
  • labour-intensive or convoluted assurance processes
  • hard to find and slow help and support

Drafting the guidance

We’re looking for API delivery teams from across government to get involved in this work. We’re hosting a workshop on 24 April with the API and Data Exchange Community of Practice to discuss the guidance we’ve been working on with GDS, HMRC and DWP. 

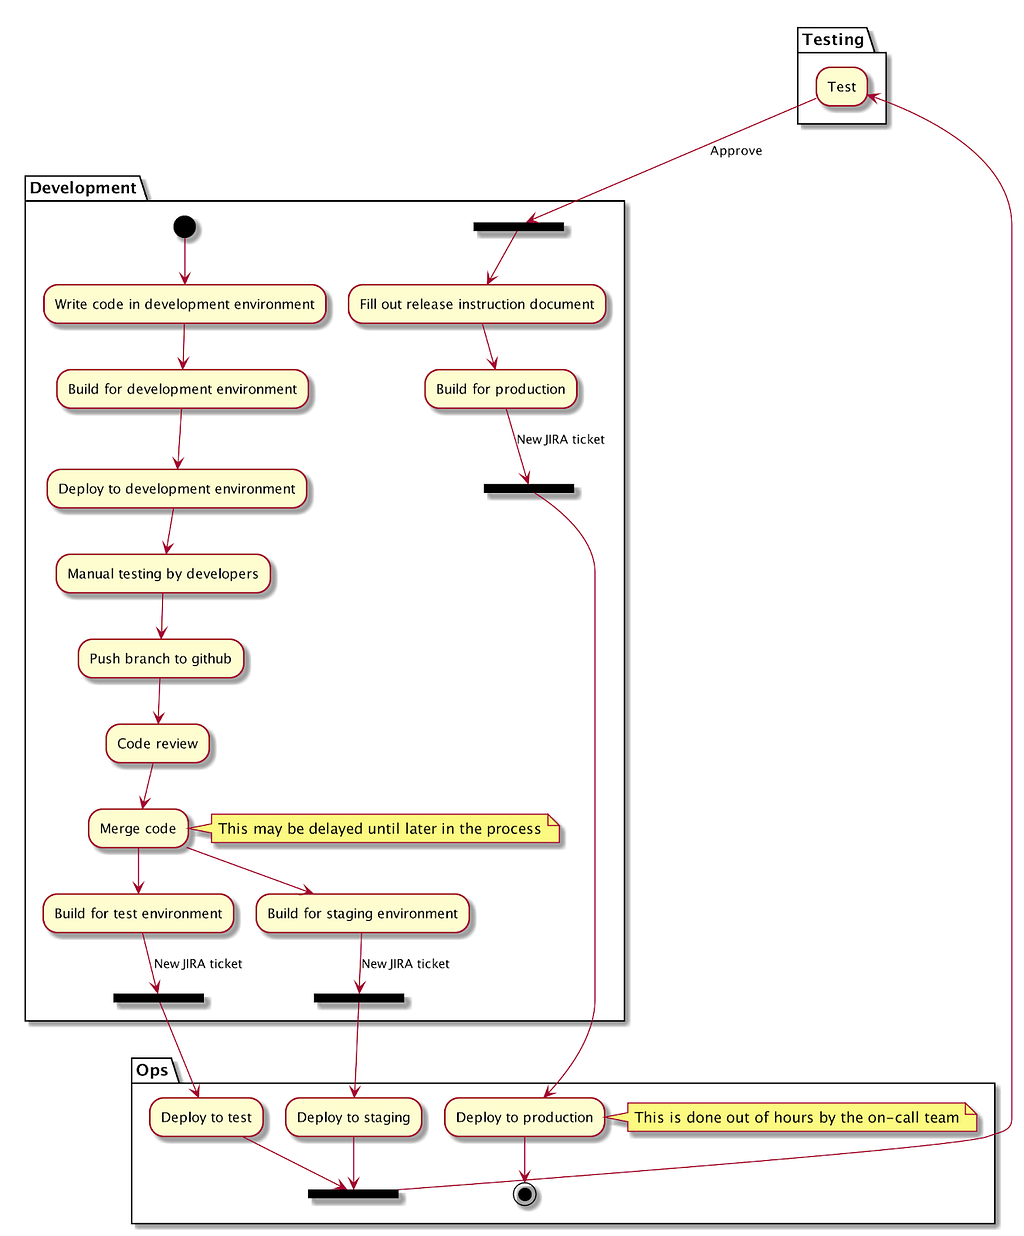
At the basic level, our understanding of API delivery looks like this:

  1. Discovery: similar to online services, you must define the problem, understand the opportunity, and find users (software developers and end users)
  2. Alpha: prototype different API specifications and, possibly, a callable sandbox that software developers can test
  3. Beta: similar to online services, put the API into production but continue to gather feedback from software developers and their end users, especially on data quality, and iterate the service
  4. Live: declare the API as “stable” but continue to monitor it as usage scales up, and continue to improve it
  5. Retirement: more complicated for APIs than for online services because you might need to retire a version of an API if you make breaking changes, or manage multiple versions in parallel

If you want to help us add more details to our guidance, email api-data-request@digital.cabinet-office.gov.uk. If you want to attend the workshop ‘Delivering APIs to meet user needs’ on 24 April you can sign up on our Eventbrite page

Why the GOV.UK Design System team changed the input type for numbers

Technology in government Monday February 24, 2020 @ 11:37 • 15 days ago

A screenshot of the new number input guidance

To provide users with a good service, government organisations usually need to collect data. Lots of data. The GOV.UK Design System team publishes patterns and components that let users enter their data in an easy and accessible way. The last thing we want to do is create barriers to users completing a task and force them to find an alternative method of using the service, such as phoning a helpline. 

Numbers are one of the most commonly asked for pieces of data, typically used in dates. We know from user research that some users prefer the large buttoned number keyboard (resembling a telephone keypad) for entering numbers on mobile. Until now, the GOV.UK Design System date input component used the HTML element <input type="number"> to provide this number keypad when a user enters dates.

A large buttoned keypad used on Android devices

Large buttoned, easy to use number keypad on Android

However, we recently moved away from <input type="number"> to <input type="text" inputmode="numeric" pattern="[0-9]*"> and published new guidance on how to ask users for numbers.

Why type=number is problematic

Although we have user research from 2017 that didn’t flag any major issues with <input type="number">, we identified many usability problems with this input type.

1. Accessibility

We found that <input type="number"> :

2. Incrementable numbers

It's reasonable to assume that <input type="number"> can be used for collecting any numeric data: it contains the word “number”, after all. However, a note in the HTML specification states that <input type=”number”> is “not appropriate for input that happens to only consist of numbers but isn't strictly speaking a number”.

This means that <input type="number"> can only be used for incrementable numbers, such as dates or the number of people in a household. Using <input type="number"> for collecting numbers that are not incrementable can cause problems with browsers validating them in that way.

For example, browsers attempt to round large numbers when incrementing or decrementing (pressing up or down key), and in the case of very large numbers they are converted to exponential notation.

Chrome 79.0: type=number displays large numbers in exponential format if user presses the up or down arrows on their keyboard

Once the number is parsed by the browser as an exponent, as shown above, and possibly by mistake, the action cannot be reversed by the user. This could confuse users. 

If users access your site using older versions of Safari, <input type="number"> can also be problematic when collecting values of 16 or more digits. In Safari 6, the browser rounds the number when a user leaves the field, so no mistake with up or down keys is required.

Safari 6 rounds the last digit on blur

Safari 5.1 attempts to make values with at least 16 digits more readable by inserting commas.

Safari 5.1 attempting a more human readable number on blur

3. Letters 

The HTML spec states that when using <input type="number">, “user agents must not allow the user to set the value to a non-empty string that is not a valid floating-point number”. The web and Android versions of Chrome implement this by silently discarding all letter input except the letter ‘e’.

This means users are not given feedback on what type of characters <input type="number"> accepts, and assistive technologies don’t alert the user that their input has been silently discarded.

4. Scrolling 

Users can accidentally increase or decrease the number using the scroll wheel on the mouse or the scroll gesture on their trackpad. This feature can be useful when collecting countable data but bad if entering data such as passport numbers.

The solution

Using <input type="text" inputmode="numeric" pattern="[0-9]*"> allows for a degree of separation between how the user enters data (“input mode”), what the browser expects the user input to contain (type equals number), and potentially how it tries to validate it. 

Prior to 2019 there wasn’t enough browser support, especially on mobile devices, for us to feel confident in rolling this out instead of using <input type="number">. However the inputmode attribute is now supported by all the mobile browsers we test in.

We still include the pattern attribute for backwards compatibility with older iOS devices.

We’ve now updated the date input component and the rest of the relevant patterns.

We’ve also published some guidance to help users to understand how to collect numbers in HTML forms.

Finally, we’ve proposed a change to the HTML spec guidance to cross reference inputmode when using <input type="text"> with content that is only numbers

You can take a look at the GOV.UK Design System backlog to see what else we’re working on.

If you're interested in learning more about changes like these, listen to the February episode of the GDS podcast.

Reporting back on our Tech Talks: Interoperability and open standards event

Technology in government Friday February 21, 2020 @ 09:07 • 18 days ago

Attendees listen to a presentation at the GDS API event

I sit in the Service, Design and Technology Standards programme in the Government Digital Service (GDS) and a lot of my work involves looking at the standards landscape to see how we can improve interoperability within government, especially in the areas of data, APIs and documentation. 

This is a collaborative effort and involves relying heavily on thoughts and guidance from the government API and Data Exchange Community of Practice. 

The community recently attended a morning of ‘Tech Talks’ at GDS on the topics of interoperability and open standards. The talks were from speakers who are leaders in their space, and helped us open up some of the conversations within the community and consider new goals for what we are trying to achieve. 

Dan Appelquist: “What’s new in web standards?”

The first speaker was Dan Appelquist, who previously worked at GDS on Open Standards, while also contributing to the Government API Standards. Dan is Head of Developer Advocacy for Samsung Internet, co-chair of the W3C Technical Architecture Group, and continues to be a member of the UK Government Open Standards Board. 

One of my first take-aways from Dan’s talk was that as government, we have enormous potential to get involved in discussions on web standards taking place in the W3C community and to help set web standards. Something we should be doing more, as part of our focus on open data standards, is joining these discussions and helping to make sure they meet the needs of government users. 

Dan also discussed data ethics, and encouraged attendees to consider aspects such as accessibility, internationalisation, privacy, and security on the web. He shared the W3C Technical Architecture Ethical Web Principles he worked on, and reiterated the need for the web to prioritise the needs of the marginalised over the comfort of the privileged, an ethic GDS is strongly focused on. 

For example, when designing new services, it’s important to consider some users will be using low bandwidth networks and low spec phones and devices.

Lorna Mitchell: “Introduction to OpenAPI”

Lorna Mitchell is a Developer Advocate for Nexmo, and regularly talks about how useful she finds the OpenAPI spec for her work there.

Last year the Open Standards Board passed OpenAPI 3 as a standard for the rest of government to use, but purely for documentation purposes. 

What Laura helped us all understand is that there is tremendous value in also using the spec for design-first purposes. 

She walked us through the tools that can work with Open API 3 to do this. Ideally this design would involve collaboration between the writer, the software engineering team and the product manager. Lorna also showed us how Open API can help you poke around with unfamiliar APIs.  

Lorna also encouraged the audience to use metadata descriptions for their APIs, as these descriptions were essential to the findability of the API online. 

Kin Lane: “An API-first structure”

Kin Lane describes himself as an API Evangelist for all APIs. Kin is most known for his work with the US government as a consultant and as the Presidential Innovation Fellow for the US Department of Veterans Affairs. He is currently the Chief Evangelist at Postman.

Kin built on Lorna’s talk, discussing how API design-first is essential to an organisation’s API strategy. An API-first structure helps you prioritise users and deliver better quality APIs for use across desktop, web, mobile, and device applications. ‘API mocking’ and using a design spec like OpenAPI ensures that the people and processes that engage with these applications are considered throughout their development and evolution. 

The other important take-away I took from Kin’s talk was that it’s important for API development teams to tell the story of what their API does. 

It’s easy for development teams to get bogged down in the technical and delivery detail but Kin was very clear that they need to tell the wider story of what their API will bring to government or government users. 

While it is true that APIs are often a very technical and abstract concept which requires a more technically-inclined individual to engage, APIs are something that impacts everyone - business users and developers - across today's digital landscape.

Tweet from Daniel Appelquist that says "One of the best insights from @kinlane's talk on Open APIs at today's GDS tech talk was the importance of stories & storytelling in building & maintaining an ecosystem around APIs in any organisation. Storytelling is such an important part of the advocacy toolkit – in any area."

Come along to our next data exchange event

We are holding an event on 16 March in London with the National Archives to discuss long-term data management. You can find more information and sign up via our Eventbrite page.

Moving towards Continuous Delivery

Just Tech Tuesday January 14, 2020 @ 08:53 • 2 months ago

by Bethan Palmer and Mat Moore (Software Development Profession)

In LAA digital, we are moving towards Continuous Delivery as part of modernising CCMS (Client and Cost Management System). CCMS is one of several legacy services we are modernising in the MOJ. So far we have been focusing mainly on one part of CCMS, the Provider User Interface.

Continuous Delivery is the ability to get changes of all types — including new features, configuration changes, bug fixes and experiments — into production, or into the hands of users, safely and quickly in a sustainable way. https://continuousdelivery.com/

Historically, the deployment process for CCMS has involved a lot of steps, and a lot of different people need to be involved throughout the process to get a change from development to production.

When a release process is complex and time consuming, releases happen infrequently. Because they happen infrequently they are risky as they contain a lot of changes. And because they are risky they tend to happen even less often. So there becomes a cycle of infrequent releases which is difficult to break out of. We wanted to avoid this situation by moving towards frequent deployments to production.

Things that we want to change

The bottlenecks in the deployment process were:

  • Deployments needed to be planned, and required approval from various people to proceed
  • We needed to do a lot of manual testing, and our case workers or the live support team also manually smoke tested each deployment to make sure we hadn’t broken anything
  • We needed to run separate builds for each environment we deploy to, instead of building a single artefact and deploying it to each environment in turn
  • We had to develop the code in a shared development environment, which was firewalled off from the internet and difficult to work on

We are working to remove these bottlenecks so that we can deploy to production quickly and easily. Our end goal is to promote changes from the development environment through to production in less than 15 minutes.

What we’ve done so far

Below are some of the changes we’ve made which are helping us move towards Continuous Delivery.

Updated the unit tests

There were already some existing unit tests, but several of them contained hardcoded paths to configuration files we didn’t have access to. We re-wrote some of these tests, removed some of them, and wrote some new unit tests to increase our test coverage.

Added CircleCI (continuous integration)

We added an integration with CircleCI, which runs our unit tests every time we create a Pull Request in GitHub. It also checks our code’s dependencies for security vulnerabilities every night. Eventually we want to automate deployments from here too.

Written some end to end tests

We’ve written some browser tests that automate someone clicking through the application. Running these gives us confidence that our changes haven’t broken any of the basic functionality.

Improved the application build process

We have replaced the old Ant build with a new Gradle build. Ant and Gradle are both build automation tools for Java applications, but Gradle has several advantages over Ant. For example with Gradle we are able to delete checked in dependencies and use remote ones, making it much easier to upgrade them. Gradle is a simpler tool for developers to use and the build process is quicker, which makes developing code changes easier.

Created a Docker/Tomcat build we can run locally

We are now able to build the application and deploy it to Tomcat running in a Docker container. This means we can develop and test our changes locally instead of relying on the shared development environment, which is very difficult to use. This gives us a much quicker feedback loop when doing development work.

Spiked out what our ideal deployment pipeline into AWS might look like

We did a spike to demonstrate how our end goal might work with a simple Hello World application. This involved creating a pipeline in CircleCI that builds the app, tests it, and deploys it to multiple environments in AWS with zero downtime. We also want to look at spinning up ephemeral environments that get deleted after a certain amount of time. Another department in the MoJ, the Office of the Public Guardian, had already created a similar deployment pipeline so we were able to use their work as a guideline for ours.

Next steps

Migrate to AWS

CCMS could not be included in our previous migration to AWS. Now that we have a better understanding of the process, we intend to repeat the same steps to move CCMS out of the current data centre and deploy into public cloud. This will reduce the cost of running the service, but will also allow us to run fully automated deployments. This enables us to make changes more quickly and safely.

Increase our test coverage

Our test coverage is still very low (6% for the Provider User Interface). We want to increase this so that we have less reliance on manual testing, and can be confident we are releasing changes safely.

Adopt Continuous Deployment

When we have achieved Continuous Delivery, the next step is to move to Continuous Deployment (where the release is automated from CircleCI rather than a manual process, and there is zero downtime).

If you enjoyed this article, please feel free to hit the👏 clap button and leave a response below. You also can follow us on Twitter, read our other blog or check us out on LinkedIn.

If you’d like to come and work with us, please check current vacancies on our job board!


Moving towards Continuous Delivery was originally published in Just Tech on Medium, where people are continuing the conversation by highlighting and responding to this story.

Our next cross-government API event on 13 November with DWP

Technology in government Tuesday November 05, 2019 @ 09:57 • 4 months ago

Group discussion during API event

The agenda is now live on our Eventbrite page and contains a good selection of technical and strategic talks, as well as some case studies and a panel discussion. 

API reuse discussions on the agenda 

I’m particularly looking forward to the discussions on API reuse. When launching the government API catalogue a few weeks ago, we cited one of its core objectives as helping improve transparency of API development across government. That it has done, with even the few APIs that have been added already. 

What the catalogue could also potentially do is get API development teams thinking about how components they design can be reused across government. 

But the question is how much is API reuse even possible, and what are we talking about when discussing reuse? API reuse could refer to:

  • API processes, like how clients do testing 
  • API functionality, like the access rights and security policies implemented, or the documentation template used 
  • the data sets the APIs call
  • the whole API, like is the case with GOV.UK Pay and GOV.UK Notify, which are both treated as products each time they are deployed by a government organisation

At the meetup, we’ll be hearing from DWP and HMRC on what kind of API reuse they think is possible, and what API development teams should be thinking about when developing an API with reuse in mind. 

Suppliers welcome at this meetup

We’ve held quite a few API meetups in recent years but this is the first time we’ve given suppliers a voice in the agenda and really tried to make them feel welcome. 

It’s important we involve suppliers working on APIs in the public sector so we can learn from suppliers’ cross-government views and approaches as they implement similar APIs in many different departments. This will also ensure suppliers follow the same thinking and best practices as the rest of the cross-government API and data exchange community. 

We'll also hear from more niche suppliers in areas such as API management on what they think the future will hold for tooling - we’ll be holding a panel at the event on the future of API management to try to get some thoughts in this particular area.

A good mix of technical and strategic talks 

The API meetups we’ve been holding for the last couple of years have been slowly changing from more technical discussions (as we tried to nail down the Government API standards and the accompanying guidance) to more strategic discussions (as more departments are launching full API strategies). 

At this event, we’ve tried to ensure a mix of both technical and strategic talks so the event can appeal to all of those in the API community, from the technical architects and the rest of the API design team, to those in senior management setting the API strategies. 

This meetup will focus on some more technical and practical areas, like how we, best support clients to test our APIs, think about designing data APIs and do user research for APIs.

We’ll then be moving on to some strategic discussions, like how the Ministry of Defence (MOD) is moving to an API First organisation. We'll also hear how the Italian government is working with the API international standards community and how Newcastle is using APIs as an asset. DWP will present on how it's using APIs to transform its organisation.

Join the Government API and data exchange community

Our event on 13 November is unfortunately already sold out but please email us if you would like to join the waiting list for the event and the Government API and data exchange community. Being part of the community means you will be kept updated on more events like this. 

The full agenda of the event is below. 

Agenda

09:30am to 10am: Coffee and networking

10am to 10:10am: Welcome, Rosalie Marshall, Government Digital Service (GDS)

10:10am to 10:30am : 4 ways we’re improving API and data exchange capability, Rosalie Marshall (GDS)

An update from GDS on the launch of the API catalogue, new guidance on API management and API principles, the data standards work and the updated API standards.

10:30am to 10:50am: API user research for COGS, Alex Tucker and Bill Roberts (Office for National Statistics and Swirrl)

Where we are with API user research and design for the Connected Open Government Statistics project with ONS.

10:50am to 11am: API Reuse: how straightforward is it? Richard Baines (HMRC)

The ability to reuse APIs is often cited as a potential benefit to creating them, but is it as clear cut as it seems? Some lessons from HMRC’s experience in implementing its API strategy.

11am to 11:25am: The Benefits API: a case study on cross-government working, Jacqui Leggetter (DWP)

A talk from DWP on the Benefits API between DWP and NHS, covering its reusable components and its benefits to the Blue Badge Scheme.

11:25am to 11:40am: An Ofgem API case study, Deborah Fehindemi (Ofgem) and Valtech speaker TBC.

11:40am to 12pm: Supporting API clients, David Heath (GOV.UK Pay)

A talk from GOV.UK Pay on how to support the development process of clients using your API.

12pm to 12:20pm: Designing data APIs, Simon Worthington and Andy Bennet (Register Dynamics)

How data APIs are different from transactional APIs and how to best design them to make it easy to keep data up-to-date.

12:20pm to 1pm: Buffet lunch & networking (hosted by DWP)

1pm to 1:20pm: How we as a city can push APIs as a city asset, Dr Luke Smith (Newcastle University’s Urban Observatory)

1:20pm to 1:40pm: NHS (TBC), Jonathon Telfer and Mark Chapman

1:40pm to 2:00pm: Moving the MOD to an API-first organisation, Richard Williams and John Wharton (MOD)

2:00pm to 2:15pm: Break

2:15pm to 2:20pm: Video - how we work with API international standards to drive consistency, Roberto Polli (Italian Government)

2:20pm to 2:35pm: Using APIs to help drive business transformation, Andy Penrose (DWP)

A talk from DWP on how they are using APIs to transform their organisation and remove some of their operational silos. This will also cover API enablement and the 6 key things DWP have identified that make an organisation API ready.

2:35pm to 2:55pm: Panel - the future of API Management

Panellists: HMRC, DWP, NHS, Mulesoft, WS02

2:55pm to 3:00pm: Close, Rosalie Marshall

Add your API to the cross-government catalogue

Technology in government Friday October 11, 2019 @ 09:51 • 5 months ago

We’re inviting government organisations (both local and central) to post details of their APIs on GitHub so we can improve the picture we have of development taking place across government and the types of data sharing occurring. 

Why we need more transparency and consistency in the API space 

Even though there’s more cross-government working in the API space than ever before, there are still many cases of government organisations developing APIs in isolation. This can lead to the government solving the same problem multiple times, often in different ways. 

GDS, along with the API and Data Exchange cross-government community, maintains a set of API Standards and API design guidance, and holds regular API events, all in order to agree common standards and the sharing of best practice. Collaborating on a list of APIs should create more transparency in the development space, and should further help government development teams communicate with each other about challenges and approaches. 

Publishing an open list of government APIs is an approach increasingly common internationally. At a recent API event, Canada’s Office of the Chief Information Officer presented on its cross-government API Store

The Canadian API Store is a catalogue of government APIs to increase findability, and is a collaborative effort across government. Users can discover services or data through the API Store to help the Canadian government’s ‘tell us once' programme of work.

Other governments running similar projects include the US government 18F delivery service, the French government, and the Italian regional government of Umbria.  

How to add your API to the collaborative catalogue 

We’ve outlined the Terms of Use for the API Catalogue in the GitHub repository to give a clear understanding of how the API Catalogue will work.

Adding your API to the catalogue is quick and easy. 

  1. Open a GitHub Issue. 
  2. Include a link to your API’s base URL and documentation.
  3. Submit the GitHub issue for review.

GDS will review the API Catalogue regularly, respond to Issues and close Issues with APIs that do not follow the Terms of Use. 

The catalogue is limited to APIs that exist between government organisations, or between government organisations and industry, or that publish open data. 

How you can feedback on this work 

We will run a feedback session at one of the next API events to see how departments and local government find contributing to the list. Our next API meetup is in Newcastle and will be hosted by DWP and open to both government employees and suppliers. If you want to attend, you can sign up on the Eventbrite page

Alternatively you can reach out to us in the comments below or send an email to our Service, Design and Assurance team.

Improve CSVs and API descriptions with these Open Standards Board recommendations

Technology in government Wednesday October 02, 2019 @ 09:34 • 5 months ago

Make things open it makes them better

Over the summer, the Open Standards Board received proposals for a standard and specification. Contributors suggested an open standard to make it easier for the government to publish and reuse data, and an open specification to promote the consistent and accurate description of RESTful APIs. 

The Open Standards Board reviewed and approved both proposals and now recommends using the:

Why the RFC 4180 standard

The comma separated values (CSV) format is a popular way to exchange columns of numbers and text between software. CSV is used for publishing data tables on GOV.UK, often alongside a spreadsheet. The lack of a standard for CSV files can cause problems for people trying to reuse published data. This prompted a challenge on GitHub calling for the standardisation of CSV. 

The challenge owner, David Read, Technical Architect at MoJ and contributors worked together to develop a profile of RFC 4180, an Internet Engineering Task Force (IETF) specification, after extensive discussions on the GitHub page.

The IETF RFC 4180 is a simple document describing a standard format for CSV files. While the RFC leaves some items in the standard as optional, the profile selected by the challenge owner specifies how the standard should be used. For example, character encoding must be UTF-8 and a header row should be included with the data.

This standard allows the use of CSV files in a wide selection of software tools without editing them first. The consistent formatting makes government open data easier for people to use and saves data analysts’ time.

Describing RESTful APIs with OpenAPI 3

Another challenge was submitted to use the OpenAPI version 3 to describe RESTful APIs. The proposal was originally raised in 2016 but was deemed as too new, did not have enough supporting tools, and it was not clear if it would be supported by users.

The Open Standards Board reviewed this challenge again after the specification matured. The board did not mandate the specification as it’s not suitable for all types of APIs but has recommended its use.

OpenAPI 3 is important because it can help users to:

  • generate accurate up to date API reference documentation, no matter what programming language an API is written in
  • validate, version, maintain and update this generated documentation
  • use a consistent API description to help increase adoption of APIs across government by reducing time spent understanding different APIs

Before the Board’s decision to recommend OpenAPI 3, GDS technical writer Jon Glassman carried out further research to confirm:

  • OpenAPI 3 was the most common way to describe RESTful APIs
  • the tooling for OpenAPI 3 had continued to develop and evolve 
  • the majority of concerns raised previously were no longer valid and people were happy to recommend OpenAPI 3

There are multiple OpenAPI tools available. For example, you can send test requests to your API endpoints using different methods in the interactive API explorer.

The aim is to encourage API teams to produce definition files in a format that is readable by machines and language-agnostic. No matter what language developers are working in, they will be able to understand the API and what it can do. 

It’s important to remember that this specification only applies to describing APIs and generating API reference information. Complete API documentation also covers information like quick start guides and API keys. This is covered by our API guidance.

How to propose an open standard

If you know of an issue where an open standard for cross-government use will make things better you can submit a proposal.

  1. Visit our GitHub issues page
  2. Suggest a standard or specification that fits a user need or open a challenge to discover which standards to use in a particular situation. 
  3. The community will assess and comment on the standard’s openness, applicability and maturity.
  4. You will then need to put forward a proposal to the Open Standards Board, which will make the final decision. 

If you’d like to get in touch with any questions about open standards you can drop the team a note on openstandards@digital.cabinet-office.gov.uk or leave a comment below.

Bringing Disparate Data Sources Under Control with Good Metadata

Just Tech Tuesday September 03, 2019 @ 07:38 • 6 months ago

by Robin Linacre, Karik Isichei, George Kelly and Adam Booker (Data Engineering Team)

Photo by Stephen Dawson on Unsplash

As a data engineering team, we are responsible for harnessing data and making it simple to use for our analysts. We process data from a plethora of sources, from decades-old database systems through to microservices on our Cloud Platform. Our data needs to be quickly delivered to live webapps, and analysts who use R, Python, and Spark. This variety means we need to find a good tradeoff between consistency and flexibility in data processing.

The more we work on this problem, the more we understand the importance of tools that standardise our data processing, transforming data sources from arcane, unreliable formats into dependable, reusable commodities.

Central to this effort is the development of a standard for machine readable metadata, and the realisation that once this exists, it is useful in almost every stage of the data pipeline:

  • The metadata can serve as specification for data providers, who can easily use our open source library to check conformance of their data against the spec, knowing we will be applying exactly the same checks.
  • At data ingestion, we can automate multiple checks of whether the incoming data conforms to the metadata, yielding detailed web reports of rows which failed the checks. See here for a simple demo.
  • During data processing, we can automatically harmonise the wide variety of incoming column data types (string, float, int etc.) from different database systems into a common set.
  • We can automatically convert our system-agnostic metadata into the format required by specific data storage solutions, automating the process of setting up databases. This makes it trivial, for instance, to generate the code needed to setup an AWS Athena Database.
  • The metadata can be automatically added to a central, searchable data catalogue, enabling data discoverability. We have developed an open source GUI on top of our metadata to enable easy searching and automated SQL query generation.
  • Since the metadata for a particular table is just a json file, it can be placed under version control. The metadata is a necessary part of our ETL code, and so it lives in the same repository, meaning metadata stays in sync with the code.
  • Finally, authoring metadata is simple and fast. Taking inspiration from the jsonschema generator we can automatically generate a first draft of metadata from existing datasets, and use of our metadata schema enables autocompletion of manual edits in text editors like VS Code.

A simple example

We have developed an online, interactive demo of some of our tools, which you can find here. This notebook demonstrates how we can:

  • Produce a validation report of a dataset which validates successfully against a metadata schema
  • Produce a validation report of a dataset which fails to validate
  • Auto-create a draft metadata schema from an existing dataset

Bringing Disparate Data Sources Under Control with Good Metadata was originally published in Just Tech on Medium, where people are continuing the conversation by highlighting and responding to this story.

Organising Variables in Terraform

Just Tech Thursday August 22, 2019 @ 08:51 • 7 months ago

by Andrew Pearce (Web Operations Profession)

I use Terraform to provision AWS infrastructure for an application. The app has 3 environments - development, preproduction and production - that have the same configuration.

Terraform workspaces are used to isolate the resources and to map certain values, such as what AWS account to provision to.

Variable definitions using tfvars

Variable definitions let you set values for lots of variables at once. They can read in automatically when you run a terraform apply or terraform plan instead of individually providing them with -var=.

You can provide values in Terraform’s syntax with terraform.tfvars files, or in JSON format with terraform.tfvars.json.

terraform.tfvars.json files are how I provide values specific to each environment.

I’ve been doing this for a while, but I recently found a new way to organise, define and access these values thanks to some improvements in the underlying Terraform language.

My old way of organising variables

I used to define maps for each variable. Each map held values for dev, preprod and prod:

My tfvars.json had a lot of repeating dev, preprod, prod stanzas:

I would then access my values for each environment using a lookup function, matching the name of the environment:

This does have the advantage of being able to supply a default when the lookup fails to return a match.

My new way of organising variables

Now I am using objects to define many values:

Variables can now be organised by environment:

Values can now be accessed from the object using the environment name, which here is available in terraform.workspace:

I still have a need for variable maps, and the two can live alongside each other in the terraform.tfvars.json file.

Why I prefer this

For my purposes, this is much neater and easier to read. All the parameters for each environment are grouped together. Adding another environment would be as easy as copying the block and updating as necessary instead of adding a new line to each variable map.

I can’t speak to the performance improvements for terraform, but it has made my work faster.

You can read a full implementation of this on GitHub.

If you enjoyed this article, please feel free to hit the👏 clap button and leave a response below. You also can follow us on Twitter, read our other blog or check us out on LinkedIn.

If you’d like to come and work with us, please check current vacancies on our job board!


Organising Variables in Terraform was originally published in Just Tech on Medium, where people are continuing the conversation by highlighting and responding to this story.

When worlds collide: putting data science into production

Data in government Wednesday August 07, 2019 @ 13:11 • 7 months ago

GOV.UK is the main portal to government for citizens. It enables users to interact with government in a number of situations, from applying for their first driving licence to checking foreign travel advice before jetting off into the sun. With all of the content that’s required to support these tasks, it can be hard for users to find the relevant content they need.

To help users get to the information they need, GOV.UK uses a number of navigational aids – one of them being related links. Related links are shown to the right-hand side of content on a page, linking to other pages which may be of interest.

Currently only around 2% of the entire content on GOV.UK, or 8,000 pages, actually have related links. The rest have no related links at all. This matters because observation and analytics tell us that good related links result in shorter user journeys, enabling users to find the content that they need faster and with ease.

A screenshot of a GOV.UK page with related content links highlighted on the right-hand side

So, to improve users’ experience, we investigated whether we could use machine learning on GOV.UK to generate related links for the remaining 98% of content that had none. As a result of this experiment, we decided to implement the node2vec algorithm.

The journey to productionising related links

To productionise, at its simplest, can simply mean to move some algorithm or software into an environment where it’s used to shape the outcome of a process, later consumed by users. When applied to data science, this involves creating a joined-up and automated pipeline from individual steps, such as obtaining input data, running a machine learning algorithm and creating useful output.

Designing such a system for GOV.UK required considering a number of different problem areas to find the best trade-offs for GOV.UK itself, for GDS, and for similar projects within wider government in the future. In this post, you will read about just a few of the considerations we needed to make during the course of the project.

Hosting and running machine learning

The first choice we had to make was how we’d host the node2vec machine learning algorithm. Many cloud providers offer what’s called a virtual machine, which – to make an analogy – is simply a computer in the cloud. You can use it to install code libraries, run your machine learning and store the results somewhere. Virtual machines are popular and used widely throughout industry, including to host GOV.UK.

A popular alternative to virtual machines is serverless. Serverless is a model in which you don’t need to worry about how you host your application – meaning the infrastructure on which it runs. Serverless can host everything from fully-fledged websites to ad-hoc, infrequent tasks, alleviating the need for maintenance of the operating system on which it runs.

We chose to use a virtual machine for hosting our machine learning algorithm. Serverless is a popular and exciting technology but our development process for it isn’t fully defined. Virtual machines also act as a stepping stone towards running our applications in containers (think Docker), something that we’re actively looking into at GDS.

Jupyter notebooks meet Python

Data scientists at GDS use Jupyter notebooks for the rapid development and prototyping of solutions to data science problems. In particular, it allows code, documentation and data to live in a single place, which helps to improve both understanding and knowledge sharing between colleagues. From a developer perspective, it’s analogous to an integrated development environment (IDE), like that of Visual Studio or IntelliJ – a tool which makes the process of writing high-quality software easier through various integrations such as offering code optimisations and providing real-time debugging.

Screenshot of a computer screen showing somePython code in a text editor

Development of the related links Python modules

To automate the process of generating related links, we decided to modularise the code from the Jupyter notebooks and write it in object-oriented Python. We borrowed the approach of test-driven development (TDD) from software engineering to focus the development process and ensure functional code.

Ensuring quality links

One of our goals was to automate the process of generating related links. To do this, it’s necessary to have confidence in the entire process – both now and in the future. Our related links are based on a combination of how pages on GOV.UK are linked to each other and users’ behaviour on the site over a number of weeks. This means we’ll always be adapting the links we’re generating and the pages we’re generating them for.

In order to ensure a high quality of related links on GOV.UK, we added a number of steps to our process. Firstly, there are a number of pages that we never want to generate related links for or to, which we exclude at both the input and output stages of the link generation process. Next, we apply a confidence threshold to the links generated by node2vec, only allowing through those links that have a good chance of being relevant for a particular page. Finally, we generate a spreadsheet of the top 200 most popular pages, allowing our content designers to critique the related links that have been assigned to these pages and make changes where necessary.

Rolling back links

As part of productionising related links, another issue that needed consideration was what should happen if things go wrong, particularly with regards to the links that we suggest to users. This was an important consideration as GOV.UK is the digital face of government, meaning we need to ensure accuracy and relevancy at all times.

With this in mind, we decided to create and store suggested links alongside existing related links for each content item, using a new property in the content schema. This was how we implemented our A/B tests and allowed us to switch between the control and test variants of related links via our content delivery network (CDN). We implemented a similar mechanism (called an operations toggle) via our CDN to show suggested related links. This allows us to switch off these links sitewide, which might be necessary if we detect a batch of bad links has been ingested, or similar.

photo of four members of the Related Links team all viewing a computer screen

Generating related links as standard

Since completing the work to productionise related links, we have been running the process every three weeks and using the links generated to update our content store. Our generated related links are automatically displayed on GOV.UK when publishers haven’t set their own links, ensuring we do as much as possible to help users find the content they’re looking for.

Next steps

We’re continuously iterating and refining the related links process, and monitoring results to ensure users’ experiences are improving. In the future, there’s the opportunity that we can bring the model online and use it as part of the publishing process, helping editors creating new content to add relevant related links. All of our code is available to view on GitHub.

If you'd like to know more about how we productionise related links and what we're doing next, please get in touch in the comments below

How to use multi-stage Docker builds

Just Tech Friday July 26, 2019 @ 07:30 • 8 months ago

by Tom Withers (Software Development Profession)

Photo by Guillaume Bolduc on Unsplash

Docker has revolutionized the way software engineers build applications; small maintainable pieces of software that can be easily scaled to meet demand. But with new technology, there are now more things to take into consideration. One such issue that arose with Docker is image size. Traditionally, to get an efficient docker image, you would use some complex shell commands within the Dockerfile to keep the layers as small as possible.

In Docker 17.05, multi-stage builds were introduced and this means we can now make docker images even smaller. Below, I’m going to go over an example of how to do this with a Symfony app and composer.

With multi-stage builds, you can use multiple FROM commands within a single Dockerfile. Each FROM command can use a different base and symbolises a new stage in the build. The most useful thing is that you can selectively copy artefacts from one stage to another leaving everything that you don’t need behind.

So let’s create a new Dockerfile and add our first FROM command. This will be using composer as a base image, so we can get all of our composer dependencies. We can also name the different stages within the build by adding AS <NAME> to the FROM command.

FROM composer AS composer

Now let’s copy over our composer.json and composer.lock files. We’re also going to add a RUN command, which will run a composer install.

FROM composer AS composer
COPY composer.json /app
COPY composer.lock /app
RUN composer install

So the first part of our multi-stage build is done, this will allow us to install our composer dependencies into the first image and then copy them across into the final image.

Next, we need to build our final stage:

FROM php:7-fpm-alpine
WORKDIR /var/www
COPY ./ /app
COPY — from=composer /app/vendor /app/vendor

Here, we start a new build using php7-fpm-alpine as the base image, then we use COPY to copy over the vendor folder into our new image. We leave all the composer gubbins behind, and it’s not saved into our final image.

The full Dockerfile looks like this:

FROM composer AS composer
COPY composer.json /app
COPY composer.lock /app
RUN composer install
FROM php:7-fpm-alpine
WORKDIR /var/www
COPY ./ /app
COPY — from=composer /app/vendor /app/vendor

You only need a single Dockerfile. Just run docker build and docker the build process will start.

The end result of using multi-stage builds is a slim production-ready image without any complexity. I hope you can see the benefits of using multi-stage builds and I would definitely encourage you to try them out!

If you enjoyed this article, please feel free to hit the👏 clap button and leave a response below. You also can follow us on Twitter, read our other blog or check us out on LinkedIn.

If you’d like to come and work with us, please check current vacancies on our job board!


How to use multi-stage Docker builds was originally published in Just Tech on Medium, where people are continuing the conversation by highlighting and responding to this story.

Working Days Calculator

Just Tech Tuesday July 09, 2019 @ 07:31 • 8 months ago

by Rob Nichols (Software Development Profession)

Photo by Estée Janssens on Unsplash

Working out how many working days there are between two dates requires not only knowledge of when weekends fall, but also when bank holidays occur. As bank holidays are moved or created to coincide with key national events (Royal Weddings for example), a simple calculation or static data lookup is not a good long term solution.

In this article, a solution is described that gathers bank holiday data from a GOV-UK API, and uses that data to calculate working day intervals.

A Ruby Solution

There are a number of gems that will do working day calculations, but to keep them up-to-date they require a list of bank holidays to be passed into them. They make the calculation simpler, but a system to gather bank holiday data is still required.

The API

There is a GOV-UK API that returns up-to-date bank holiday data.

Gem selection

There were three main gems considered:

Of these, business_time was last update two years ago. The other two gems both appear to be more regularly maintained. Both business_time and working_hours monkey patch the core Ruby time objects Time, Date and DateTime. As the scope of usage for this project was limited (there was currently only one calculation to be made), using a gem that didn’t monkey patch core objects was a better fit. That left the business gem — and this was selected.

Retrieving the data

The first task was to create a service that would retrieve the data from the API. The solution was BankHolidayRetriever, which called the API via Net::HTTP.get_response, parsed the resulting JSON and extracted the array of dates from the required section of the data.

Storing the data

The next task was to store the data to locally cache it. After some consideration as to whether to store the data in memory, or in a memcache, it was decided to use the simplest solution of storing the data in the database via an ActiveRecord Model.

The model was created with a generator:

rails g model BankHoliday dates:text

It was then modified to add serialization of dates to store the array coming from BankHolidayRetriever.dates, some simple validation, and a callback that populated dates on creation.

A class method BankHoliday.dates was added that would retrieve the latest updated instance of the model and return its dates, or create an instance if none exists.

Also added to the dates class method call, was a call out to a worker that would update the current data. In this way the bank holiday data will be updated as it is used.

The update worker

As Sidekiq was available in the current project, a worker was added that will update the Bank Holiday data. Its first task is to see when the last update occurred. If the last update is less than a certain interval old (currently two days), the worker would just close without doing an update.

If an update is required, the worker uses a new instance of BankHoliday to gather the latest data. It then compares that data with the latest stored data. If the two match, the “updated at” date of the last persisted BankHoliday instance is updated (via touch).

If the latest stored data does not match the retrieved data, then the new instance is saved and it becomes the latest stored data in the database.

Note that failure to retrieve the data or save it to the database, raises an exception. When this happens within a worker, this will cause the worker to be put into the retry queue for it to be run again later. In this way short term API and or data errors can be handled without adding additional code.

The Calculator

With the system now able to return an up-to-date array of bank holiday dates, it was a straightforward task to create a working day calculator using the business gem.

As this gem accepts the dates as strings, there was no need to convert them to dates first, which simplifies the code.

At the time of writing all that was required was a way of returning a date a number of days ahead of today. As the business gem provides a number of working day calculations, it will be fairly simple to extend the functionality as required.

The end result

With these changes in place, within the app the date ten working days from now can be returned with the call :

WorkingDayCalculator.working_days_from_now(10)

Making that call will trigger a worker that will check that the data is up-to-date for the next call.

The complete set of code with specs, within the context it was used can be seen in the Pull Request.

If you enjoyed this article, please feel free to hit the👏 clap button and leave a response below. You also can follow us on Twitter, read our other blog or check us out on LinkedIn.

If you’d like to come and work with us, please check current vacancies on our job board!


Working Days Calculator was originally published in Just Tech on Medium, where people are continuing the conversation by highlighting and responding to this story.

A or B? How we test algorithms on GOV.UK

Data in government Wednesday June 19, 2019 @ 16:37 • 9 months ago

GOV.UK is home to guidance, news and information from all government departments. We have over 400,000 unique pieces of content, and to give our users the best experience, we need to get them to the most useful content as quickly as possible.

One way of doing this is by adding links to the ‘related content’ section on the right-hand side of each page, so that users can easily navigate to similar pages.

Image showing the UK bank holiday page on GOV.UK, with a right side panel showing two related content links, namely “Holiday entitlement” and “School term and holiday dates”

Creating related links

Historically, related links were hand-curated by content publishers with expert domain knowledge. Around 2,000 pages on GOV.UK have these links and to extend this feature to all pages would take a long time. This is where data science can help.

A variety of methods have been documented to have worked well in industry for this task; we needed to test these on our specific use case. We used machine learning algorithms based on our previous work on semantic similarity and network science (log likelihood ratio and Node2Vec) to generate these links automatically.

What would success look like?

We use the scientific method to empirically evaluate any changes we make to the site. We formulate hypotheses and test their falsehood using evidence. We organised workshop sessions with a diverse team of GOV.UK experts to decide on testable hypotheses.

Image showing three people in a workshop, with post-its on the window.

We explored the data available to us to see what we could measure during the test. We presented the options back to our team, explaining how they would be calculated and their feasibility. As a team, we discussed which metrics were expected to change if the newly-generated links were any good. We narrowed it down to a handful of metrics that could be framed as null hypotheses.

A/B testing our hypotheses

Two of the null hypotheses we tested were:

  1. There is no significant difference in the proportion of journeys using at least one related link. If this is true, then people aren’t clicking our links, probably because they don’t find them useful or interesting.
  2. There is no significant difference in the proportion of journeys that use internal search. If this is true, then we didn’t provide people with relevant links to click on so they still use internal search to navigate.

To test these, we ran a randomised experiment and assigned users via a digital coin toss to one of 2 possible versions of the site with equal probability: half the users were directed to the control site (A) and the other half to the site with the algorithmically generated related links (B). This is known as an A/B test and is a popular way of testing changes to digital products.

Image showing the A and B variant versions of the “Paternity pay and leave” page on GOV.UK. The A variant on the left is the control page without any related links, and the B variant on the right has 5 related content items that were generated by algorithms

An example of an A and B variant page, on the left and right, respectively

We wanted to bring our false negative rate down below 20%, so we estimated a good sample size for each experiment; each algorithm’s related links would need to be live for about a week. This meant that we had a very short window between analysing the results, iterating algorithms to make improvements and generating the new and improved related links. So to speed up our approach we wrote code as a software package on Github that enabled us to run the analysis instantly upon experiment completion.

This initial early investment into automation reduced the risk of human error and freed up our time to implement other algorithms. Any of our data scientists could run the analysis and get consistent results to present back to the team, and each experiment was analysed in exactly the same way.

Statistical significance vs practical significance

Excitingly, both of our null hypotheses were shown to be false, meaning that something very interesting was happening on the site.

Our first hypothesis being false implies that users found the related links interesting and/or relevant so they clicked them. For our best-scoring algorithms, users were clicking our related links for over 2.4% of their journeys – that’s improved journeys for more than 10,000 users per day!

But more interestingly, our second hypothesis being false means that users don’t appear as lost on the site as they don’t use internal search as much. The results show that there’s a potential reduction in internal search by about 20 to 40% depending on the algorithm used.

Figure showing the reduction in journeys using internal search for the 3 algorithms tested. Results are: 20% for content similarity, 25% for node2vec and 35% for log likelihood ratio. All scores have error bars of about ±5%

These scores were not the only considerations for selecting our winning algorithm to deploy – we also considered the economic, social, political and technological ramifications of each approach. Out of the 2 top-scoring algorithms, we decided to implement Node2Vec as it has more potential for improvement.

Moreover, we decided that we would not replace the hand-curated links in those 2,000 pages that had them, as despite how good our algorithms are at the moment, they still do not have the same context as a subject matter expert.

Prior to this work, the vast majority of GOV.UK pages did not have curated recommended links. We automated that process, improving thousands of user journeys per day.

We are very excited to put our algorithmically-generated related links in production within the GOV.UK infrastructure and we’ll tell you how this went soon!

Natural Language Processing in government

Data in government Friday June 14, 2019 @ 10:32 • 9 months ago

The Government Data Science Partnership (GDSP) brings together public servants to share knowledge about data science. It’s a collaboration between the Government Digital Service (GDS), Office for National Statistics (ONS) and the Government Office for Science.

At our latest meet-up about 60 people, from more than 20 departments and public bodies, gathered in Manchester to discuss Natural Language Processing (NLP).

NLP is used to interpret unstructured text data, such as free-text notes or survey feedback. It can help us look for similarities and uncover patterns in what people have written, which is a difficult task because of nuances in sentence structure and meaning.

The sentence 'the cat sat on the map' with parts of speech tagging highlighted - the (article) cat (noun) sat (verb) on (preposition) the (article) mat (noun)

Labelling a sentence with parts of speech, such as nouns (‘cat’ and ‘mat’) and verbs (‘sat’), to help understand syntax.

We’ve written before about NLP for classifying user feedback and tagging pages of GOV.UK, and the Ministry of Justice have used it to identify document relationships. At the meet-up we heard from data scientists across the public sector on how NLP is being used in their organisations.

Finding patterns

Computers can do a better job than humans at identifying patterns in text datasets. On the day, 2 data scientists spoke about their use of unsupervised machine learning to help them. This is when a computer is used to find patterns in the data without any prior information about what it should be looking for.

Dan Schofield from NHS Digital was tasked with identifying meaningful groupings from the free-text input of a nationwide dataset of appointments in GP practices. He used Python to convert his documents to numbers with Doc2Vec and simplified their complexity using an approach called t-SNE (t-Distributed Stochastic Neighbourhood Embedding). Dan fed this information into an algorithm called HDBSCAN to find meaningful groups, including one that contained appointments related to injections.

Luke Stanbra from the Department for Work and Pensions presented on using free-text data to group incident support tickets and find common root causes. Like Dan, Luke used an unsupervised approach called topic modelling to solve this problem. He discussed Latent Dirichlet Allocation (LDA) to assign texts to abstract ‘topics’ that represent word distributions and how structural topic models can improve models by taking into account document-level data.

Creating pipelines

As well as unsupervised machine learning, supervised techniques are also used for NLP. This is when an algorithm predicts a label for new data based on some data that’s already been labelled by humans with specialist knowledge.

Ben Stanbury, Neil Potter and their team at HM Revenue and Customs (HMRC) used both supervised and unsupervised techniques in a pipeline to help classify and present thousands of feedback items that are received each day by the department.

HMRC staff tagged a sample of comments, and the team used this to train a supervised classification model, making use of Support Vector Machines and Gradient Boosting Machines. The model tagged incoming data when its confidence in a label was high enough. Unlabelled comments were passed into an unsupervised LDA topic model to identify emerging topics that could become new tags, ensuring data wasn’t wasted.

Diagram showing the flow of comments in the HMRC system. New comments flow into the supervised model, unclassified comments are clustered in an unsupervised model before being sent back to HMRC staff

A supervised model classifies new comments after training on manually tagged ones. Any leftover unclassified comments are grouped for review by an unsupervised model

Summarising text

NLP is not always about grouping and labelling data based on free-text content. Data science approaches can also be used to help summarise documents.

This can be a tricky and time-consuming job for a human, so Chaitanya Joshi from the ONS Data Science Campus has explored ways to speed up and automate this process with a method called extractive text summarisation.

During his investigations, he used an unsupervised machine learning method called skip-thoughts to cluster similar sentences and select the most representative ones for each cluster. The method is based on a word-level skip-gram approach but extended to sentences. It results in a small number of sentences that best represent the whole document.

Peer surgery

After hearing the talks, attendees split into groups to ask questions and get solutions from the community about how to prepare data for NLP and use machine learning to make sense of it.

One topic discussed was a fundamental problem with text data: misspellings. For example, ‘Monday’ and ‘Mondya’ will not be recorded as the same word. Suggested solutions included the use of dictionary lookups and word-clustering algorithms.

Another group discussed an open source tool from the Data Science Campus called Optimus. Optimus takes short text records and helps to group and label them automatically.

The session closed with participants feeding back on what they’d learnt from the discussions and how they can go back to their organisations with this knowledge in mind.

Get involved

Public servants can continue the NLP conversation in the #nlp channel on the cross-government data science Slack. You can also register your interest for upcoming text analytics meet-ups by emailing the organisers.

GDSP meet-ups are open to anyone in government with an interest in data science techniques. Sign up for the mailing list or join the #community_of_interest channel on Slack. The next GDSP meeting will be in London on Thursday 27 June.

Reducing cost and latency of change for legacy services

Just Tech Monday June 17, 2019 @ 11:26 • 9 months ago

by James Abley (Technical Architecture Profession)

Context

Like a lot of parts of government, the Ministry of Justice has a large technology estate. Ours includes many things which pre-date GDS spend controls. How government bought things has changed over the last 6 years. But we still have things from before that time. In this article, I’m calling those things legacy services.

Many of these legacy services are business-critical core systems without which we could not operate. It would cause massive amounts of pain/frustration if they weren’t available. Our CTO Dave Rogers has written about some of the problems faced when trying to transform these ageing services.

Delivering substantive changes to services can take time. But just because something is hard doesn’t mean it’s not worth doing. And if you do it right, you can end up in a much better place, making continuous small improvements.

Our problems

Some of the properties of these systems are less than desirable. For example, changes are very infrequent. We have services that are only updated once per year. These changes are risky affairs. Downtime with weekend work is the norm. Then there is usually the unofficially accepted post-release cleanup period. This involves further unplanned releases to address problems introduced by the planned release.

Infrequent releases are not great for the people using the system who may be experiencing frustration. Batching up fixes in this way means we are delaying improving people’s quality of life. That’s quite a blunt way of putting it; it’s meant to be.

So the cost of change is too large. Changing the services involved the work of many people over a long period of time.

The book Accelerate by Dr Nicole Forsgren, Jez Humble, and Gene Kim contains a wealth of evidence (science FTW!) about high-performing technology organisations. It talks about 4 key metrics that are useful to measure when trying to understand Software Delivery Performance:

  1. Lead time — the time it takes from a customer making a request to the request being fulfilled
  2. Deployment Frequency — this is a proxy for batch size, which is easier to measure and typically has low variability
  3. Mean Time to Restore (MTTR) — when a service incident occurs, how quickly is service restored?
  4. Change Fail Percentage — what percentage of changes to production fail?

If we’re doing one release a year, we can see that the average lead time is 6 months. Deployment frequency is annual. The mean time to restore was a week, but sometimes fixes were expedited and done mid-week rather than waiting for another weekend to do a release.

And the Change Fail Percentage was very high. Maybe not quite 100%, but not far off.

Our journey

We recently migrated all the services for the Legal Aid Agency from traditional hosting. A business case had established that moving some of the services to the public cloud would give us financial benefits.

But we also managed to eke out some other benefits as part of the migration. We have made huge improvements to the metrics mentioned above.

We had some guiding principles for the migration to public cloud:

  1. We will move out of the current data centre
  2. We will not provide the service in a way that is any worse than the current service
  3. Applications delivered into public cloud will have a stable, automated deployment pipeline
  4. Applications in public cloud should capable of redeployment during normal working hours

These were enough to get the organisation (and our users!) to a much better place:

  • We have got the lead time to the same day, for small changes/fixes.
  • The deployment frequency averaged around every 3 days* (previously it was once a year).
  • Mean Time To Restore is currently untested, but the lead time and deployment frequency numbers show that it would be resolved on the same day.
  • Change Fail Percentage has dropped to 0%.

How we did this

Deployment pipeline

A deployment pipeline is an automated manifestation of your process for getting changes into an environment. Adopting a deployment pipeline means that all changes have to go through version-control. A change happens in version-control and that starts a build. This enhancement to the system in how people worked ensured visibility of changes.

The application/service gets built once and then deployed everywhere with the relevant configuration for that environment. This gave a nice separation between things that tend to have different rates of change — the application code, and the configuration for each environment.

Trunk-based development

Trunk-based development has helped:

  • ensure small batch sizes
  • increase the frequency of deployments
  • reduce the risk of deployments
  • reduce the time spent merging long-lived branches.

And we can try to break down work so that useful increments can be delivered regularly.

Stabilisation periods are no longer necessary. Time spent doing difficult merges of long-lived branches that have diverged a long way from the main trunk branch is no longer needed.

Adding automated tests

Many of the legacy services were created when Test-Driven Development and other practices were not as widespread. They do not have a vast suite of automated tests with a high level of coverage which give us the confidence to know we aren’t breaking things.

The most valuable investment we decided we could make was adding functional tests which exercised the way our users would typically use the applications. If we could replicate the happy path of how people used the system, we could manage the risk that:

  1. The migration would not break anything
  2. We could continue to improve and fix things post-migration

These sorts of tests are slower to execute, since they typically need a few distributed components, but they gave us the best level of coverage when working with code bases that had not been designed to be testable.

As part of the deployment pipeline, these tests are a quality gate that runs for every potential change which might go in front of our users.

Eliminating waste

From a Lean sense, we have also eliminated various wasteful activities.

When we had long-lived branches, we used to have a different environment per-branch. People had to track which version was in which environment.

Now that we’re doing trunk-based development with the ability to deploy to production on the same day, we don’t need to do that. If someone asks what version is in environment X, we always know:

  1. The deployment pipeline keeps track of it now, rather than a person, so check what the deployment pipeline says is deployed in environment X
  2. But mostly the answer will be “trunk”

We have also got rid of several environments; we no longer need to pay for them, or manage them, due to our new ways of working.

Conclusion

We started the migration wanting to realise the cost-savings available to us from using public cloud. In truth, we know we are still very early on in the journey for this part of the organisation. And it’s not evenly distributed. Some of our colleagues have to work with bits that are still harder than they should be to change and improve.

But we have achieved lots of small improvements. Small batch sizes:

  • reduce risk
  • give opportunity for faster feedback and learning opportunities
  • are faster to deliver value to the organisation and our users

That is such a massive difference for the organisation, and something we should be immensely proud of.

*It was quite high for a while because, for the first time, we had better insight about how the systems were running in production. We could access the logs and see the graphs. We could see the unreported frustrations that our users were tolerating or working around every day. So we fixed them. For most of the teams now, it’s a capability that they can choose to exercise as part of their normal sprint cadence (typically fortnightly).

If you enjoyed this article, please feel free to hit the👏 clap button and leave a response below. You also can follow us on Twitter, read our other blog or check us out on LinkedIn.

If you’d like to come and work with us, please check current vacancies on our job board!


Reducing cost and latency of change for legacy services was originally published in Just Tech on Medium, where people are continuing the conversation by highlighting and responding to this story.

Automated Unit Testing of PL/SQL

Just Tech Monday June 10, 2019 @ 13:30 • 9 months ago

by Laurence Barea (Software Development Profession)

As we moved to the adoption of CI/CD during our infrastructure and application migration to AWS, there was always a question mark surrounding Oracle and PL/SQL releases; we did not have the tools or frameworks available to allow us to deploy Oracle releases via a pipeline, which is not ideal given our goals for deployment automation are concerned.

Testing is backbone of continuous delivery model.

The problem we are having is that although many programming languages out there lend themselves to this process, Oracle databases and its procedural language, PL/SQL, does not.

Currently, there is a large Oracle footprint within the estate and a correspondingly significant amount of PL/SQL code that sits outside the CI/CD pipeline resulting in Oracle releases having to be deployed manually by DBA’s. This is an issue; delays are created, the release process is made more complex and the involvement of other teams are required.

Testing database deployment

We considered Flyway by Boxfuse and Liquibase by Datical. We decided on Liquibase and have been generally pleased with the approach it takes and how it fits in to our workflow. Flyway looked promising but would have cost $3,000 to support our version of Oracle.

Testing PL/SQL

With regards to PL/SQL we have set up a proof of concept to see a couple of possible solutions in action. Initially, we considered these tools:

  • Oracle’s SQL Developer’s built in unit testing
  • Code Tester by Quest (Toad)
  • utPLSQL, a framework that’s been around for a few years which was originally developed by Steve Feuerstein himself, and
  • ruby-plsql-spec, a unit testing framework which is built using Ruby, ruby-plsql (library) and Rspec.

… and decided on utPLSQL and ruby-plsql-spec. The former because it was more well-established and the latter because of the growing Ruby competency among our teams.

The Ruby way

The conclusion is ruby-plsql-spec works great! See the Unit Testing PL/SQL Procedures From Ruby Code for a more in-depth look.

See slides here: Unit Testing PL/SQL Procedures From Ruby Code

The utPLSQL way

We deployed utPLSQL onto a development database. Unfortunately we can’t run the database locally at the moment 😞 so we share a single development database hosted in Amazon — there’s a separate piece of work going on to resolve this.

The initial challenges surrounded taking the automated install apart and doing it manually — this is because AWS RDS does not allow file-system access and it was something we could get on with straight away rather than getting the install scripts to run remotely from the DB in question.

Working with utPLSQL is very much a manual process; there is no automation — you will have to write all the test code and you will have to maintain it.

Below is some output generated utPLSQL tests run on the HUB development environment.

Between string function
Returns substring from start position to end position [.129 sec] (FAILED - 1)
Returns substring when start position is zero [.002 sec] (FAILED - 2)
Failures:
1) basic_usage
Actual: '234' (varchar2) was expected to equal: '2345' (varchar2 at "HUB.TEST_BETWNSTR", line 5 ut.expect(betwnstr('1234567', 2, 5)).to_equal('2345');
2) zero_start_position
Actual: '1234' (varchar2) was expected to equal: '12345' (varchar2 at "HUB.TEST_BETWNSTR", line 10 ut.expect(betwnstr( '1234567', 0, 5 ) ).to_equal('12345');
Finished in .131936 seconds
2 tests, 2 failed, 0 errored, 0 disabled, 0 warning(s)

Next steps

Now that we have got both these frameworks working, we need to start incorporating them into actual work so that we can better understand how best to benefit from them.

A few points we will be looking to address as we go forwards:

  • Testing across multiple databases
  • Standing up and tearing down databases as part of the automated testing
  • Transaction testing e.g. table data, rollbacks to savepoints etc.
  • Complex type testing e.g. associative arrays of nested objects
  • Integration with the code pipeline and Flyway DB.
  • Exception handling.
  • TDD going forwards with regards to the existing code-base.

If you enjoyed this article, please feel free to hit the👏 clap button and leave a response below. You also can follow us on Twitter, read our other blog or check us out on LinkedIn.

If you’d like to come and work with us, please check current vacancies on our job board!


Automated Unit Testing of PL/SQL was originally published in Just Tech on Medium, where people are continuing the conversation by highlighting and responding to this story.

Measuring against cyber security standards

Just Tech Thursday June 06, 2019 @ 11:44 • 9 months ago

By Joel Samuel (Cyber Security Consultant Team)

MoJ’s Cyber Security team is led by Jonathan Lawrence, Chief Information Security Officer, and is responsible for helping the whole department manage cyber security risks through expert advice/ guidance, incident management/ response and proactive ‘offensive’ penetration testing.

Measuring security is hard

The relatively simple concept of being sure you have the right security in place to keep systems (and the data within) safe (also known as ‘information assurance’) is easier said than done.

There are various methodologies for determining risk, measuring controls, value of controls (and so on) and each require a varying level of expertise by the assessor in order to complete them. One size definitely does not fit all when the team is responsible for cyber security in systems ranging from internal IT tools/solutions (laptops, WiFi, Google G-Suite, Microsoft Office 365, Trello, Slack and so on) to case management solutions used for administering over £1 billion a year in legal aid, as well as brand new digital services.

External standards

There are various external standards that a UK central government organisation is expected to adhere to. One of the key ones for cyber security is the Minimum Cyber Security Standard (MCSS) that was developed by the Cabinet Office in collaboration with the National Cyber Security Centre (NCSC).

The Challenge

I posed the problem of how in an imperfect cyber security or ‘information assurance’ world does the team measure a diverse range of technology solutions against the MCSS while also making the assessment method simple to use, repeatable, standardised and in a format that would allow us to compare different systems using the same measurements to identify trends horizontally… a tall ask!

Design with data

The 3rd government design principle is “design with data” and, while this is a different kind of ‘design’, I thought this principle matched the challenge really well so I decided to ensure any method created data that could be dynamically turn into information. Free-text is hard to read, analyse and update and is subject to variations in terminology and intention.

Adrian has posted about this before.

Et voila! Welcome to Standards Assurance Tables

I used a bit of math (often quite basic!), IMPORTRANGE() and a smidge of Google Script to create a template Google Sheet spreadsheet and dubbed it the Standards Assurance Table.

The MOJ believes ‘security’ can work in the open so in addition to publishing it’s IT policies, as part of an open-sourced cyber security guidance microsite, the MOJ have published how the Standard Assurance Tables work and the theory behind them.

Some information risk management concepts were maintained such as maintaining the use of ‘evidence’ (documentation, drawings and so on — not hearsay) and ‘confidence’ (how well the assessor thinks the evidence demonstrates the target system is meeting the standard) but ultimately ignored existing information risk methodologies for the purposes of this work, to create a clean, simple slate.

A horizontal view

At the same time an aggregator Google Sheet was created for collated analysis. The aggregator uses even more IMPORTRANGE() to pull all completed Standards Assurance Tables together for horizontal analysis and this works really well given data was kept as data.

As a result of this work the MOJ has already identified trends (across entirely diverse systems that have never before been compared) and this has directly led how the team are investing time and money to get the most amount of proportional security benefit while responsibly managing public funds.

Designed for scale

The table wasn’t named the “MCSS Table” because while this work began due to a particular standard I wanted to ensure any method can scale and adapt over time.

The team are now working with information governance colleagues across the MOJ to expand the objectives beyond the MCSS and build some really powerful data-driven governance and investment.

Onwards

At the moment the Standards Assurance Tables nor the aggregating Google Sheet analyse or represent change over time to keep the initial scope reasonable.

Each table already has an active Google Script that records changes as they are made. One of the things the team want to do next is leverage this metadata to help measure how systems fair over time, individually and in aggregate — which I think will be quite nifty.

If you enjoyed this article, please feel free to hit the👏 clap button and leave a response below. You also can follow us on Twitter, read our other blog or check us out on LinkedIn.

If you’d like to come and work with us, please check current vacancies on our job board!


Measuring against cyber security standards was originally published in Just Tech on Medium, where people are continuing the conversation by highlighting and responding to this story.